Loudoun Climate Project is building a network of PurpleAir particulate sensors.
These sensors test for PM2.5: fine inhalable particles, with diameters that are generally 2.5 micrometers and smaller
Most particles form in the atmosphere as a result of complex reactions of chemicals such as sulfur dioxide and nitrogen oxides, which are pollutants emitted from power plants, industries and automobiles.
Read more on particulates at https://www.epa.gov/pm-pollution
Read more on PurpleAir monitors at: https://www2.purpleair.com
Our Monitoring Stations
LCP-1
Round Hill
LCP-2
Lansdowne
LCP-11
Sterling – Countryside
LCP-4
Ashburn
LCP-12
Waterford
LCP-6
Sterling – Sterling Park
LCP-7
Aldie
LCP-8
Leesburg
LCP-15
EcoVillage near Lovettsville
LCP-10
Sterling – Sugarland
LCP-13
South Riding
LCP-16
Lovettsville
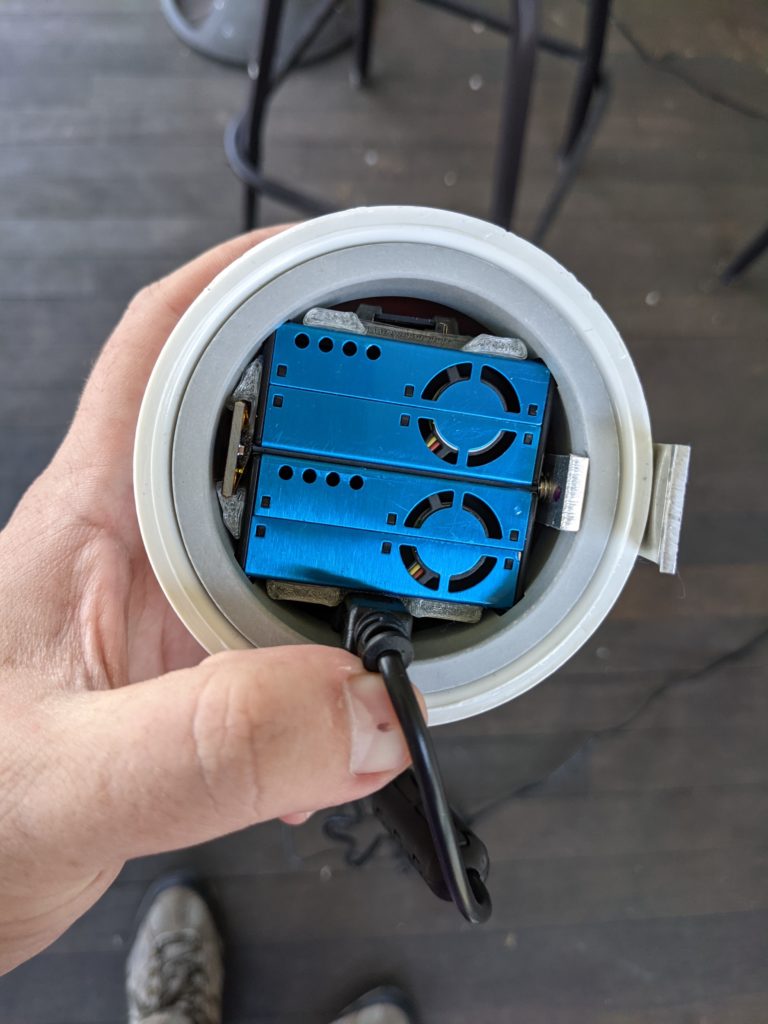
Occasionally one of our monitors will get disconnected due wifi issues. For this reason, we use PAII-SD models so that the data will get uploaded when the monitor is back online.
For all of the PurpleAir monitors in Loudoun go to https://map.purpleair.com/1/mAQI/a10/p604800/cC0#9.56/39.1529/-77.5135
To suggest a location for an air monitor please use this form: https://forms.gle/MKDB4BD8PEjNHmnN7
Air Quality Measurements and Meaning
The best data we have on what these Air Quality Index (AQI) levels mean comes from the EPA: https://www.airnow.gov/sites/default/files/2021-03/air-quality-guide_pm_2015_0.pdf
| Air quality index | At-risk population | Actions |
| Good (0-50) | No risk | Enjoy the outdoors! |
| Moderate (51-100) | People unusually sensitive to particle pollution |
Unusually sensitive people: It is advisable to reduce heavy physical activity and monitor symptoms. Overall population: Outdoor activities are still a good idea! |
| Unhealthy for sensitive groups (101-150) |
Older adults Children and teenagers People with heart or lung disease |
Sensitive groups: Outdoor physical activity is allowed. Take more breaks and reduce the outdoor time. Monitor symptoms. People with asthma: Follow your asthma action plan. Keep quick relief medicine handy. People with heart diseases: Look out for palpitations, shortness of breath, or unusual fatigue. If they are present, contact your health provider, they may indicate a serious problem. |
| Unhealthy (151-200) | Everyone |
Sensitive groups: Avoid heavy physical activity. It is best to move activities indoors or reschedule. Overall population: Outdoor physical activity is allowed. Take more breaks and reduce the outdoor time if possible. Monitor symptoms. |
| Very unhealthy (201-300) | Everyone |
Sensitive groups: Avoid all physical activity outdoors and change them to an indoor setting. Consider rescheduling to a time when air quality is better. Overall population: Avoid physical activity. Consider moving activities indoors. |
| Hazardous (301-500) | Everyone | Everyone: Remain indoors and keep activity levels low. Follow tips for keeping particle levels low indoors. |
Data Policy
It is our intention to make all data collected from all of our monitors, now and in the future available to the public at no charge.
Bulk Data Downloads:
These are zip files that contain CSV files for all of our monitors by year.
2021: Download Zip File2022: Download Zip File
2023: Download Zip File
2024: Download Zip File
Data-Driven Applications
Air Monitoring Dashboard: http://loudounclimate.org/air-monitoring-dashboard
Air Monitoring Historical Data Viewer: http://loudounclimate.org/air-monitoring-historical-viewer